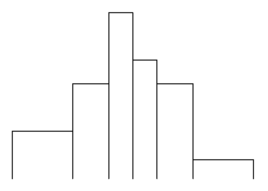
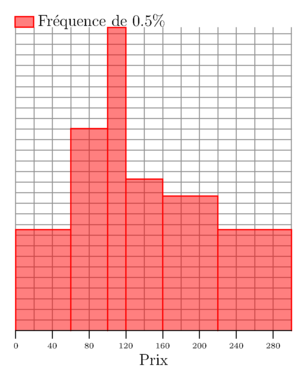
Asymptote - Figure 0001
fig_aa01_240208_histogramme.asy
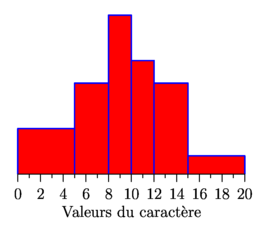
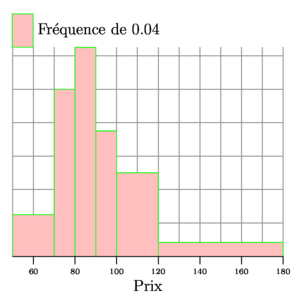
Asymptote - Figure 0002
fig_aa02_240208_histogramme.asy
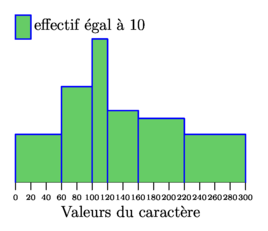
Asymptote - Figure 0003
fig_aa03_160308_histogramme.asy
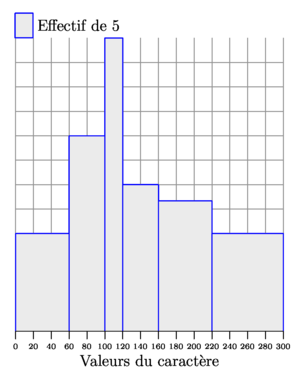
Asymptote - Figure 0004
fig_aa04_170308_histogramme.asy
Asymptote - Figure 0005
fig_aa05_211109_histogramme.asy
Asymptote - Figure 0006
fig_aa06_211109_histogramme.asy
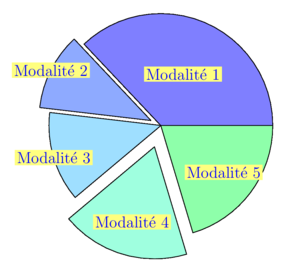
Asymptote - Figure 0007
fig_ba01_150608_diagramme_circulaire.asy
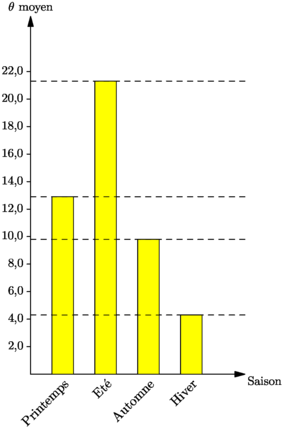
Asymptote - Figure 0008
fig_ca01_270109_diagramme_a_bandes.asy
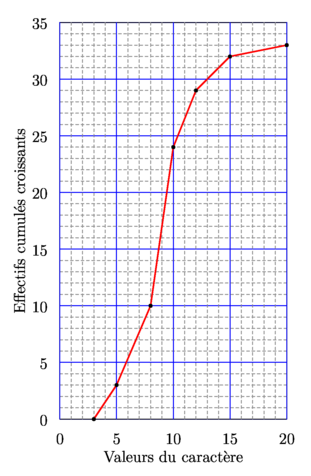
Asymptote - Figure 0009
fig_ec01_060708_polygone_effectifs_cumules.asy
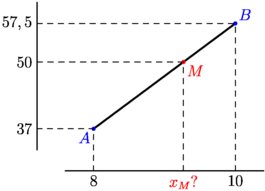
Asymptote - Figure 0010
fig_ia01_220208_calcul_mediane.asy
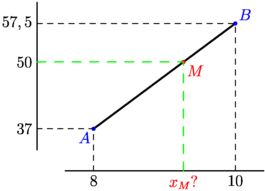
Asymptote - Figure 0011
fig_ia02_220208_calcul_mediane.asy