Liste des figures
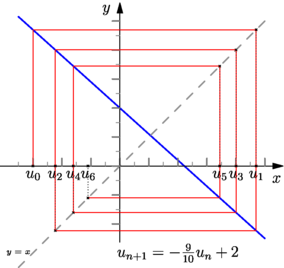
figure 0001
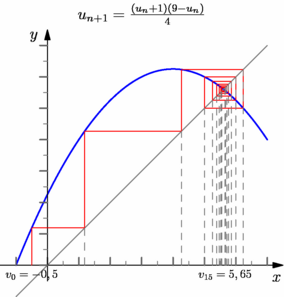
figure 0002
figure 0001
figure 0002

|
import graph_pi; size(7.5cm,0); real f(real x){return -9x/10+2;} graphicrules(unit=.8cm, xmin=-3.5, xmax=5, ymin=-2, ymax=5); draw(graph(f),1bp+blue); draw(graph(new real(real x){return x;}), dashed+.8+grey); cartesianaxis(xticks=LeftTicks("%",pTick=1bp+.8grey, ptick=grey), yticks=LeftTicks("%",pTick=1bp+.8grey, ptick=grey)); draw(recursivegraph(f,-3,n=7),.6bp+red); label("$u_{n+1}=-\frac{9}{10}u_n+2$",(2,-3)); label("\tiny $y=x$",(-3.5,-3)); |
|
|
import graph_pi; size(7.5cm,0); real f(real x){return (x+1)*(9-x)/4;} graphicrules(unit=1cm,xmin=-1, xmax=7, ymin=0, ymax=7); draw(graph(f),1bp+blue); draw(graph(new real(real x){return x;}),.6bp+grey); cartesianaxis(xticks=LeftTicks("%",pTick=1bp+.8grey, ptick=grey), yticks=LeftTicks("%",pTick=1bp+.8grey, ptick=grey)); draw(recursivegraph(f,-.5,n=16), recursiveoption(Label(scale(.75)*"v"), labelinner=false, format="=%.2f", px=dashed+.6bp+grey, automarker=nomarker), .6bp+red); label("$u_{n+1}=\frac{(u_n+1)(9-u_n)}{4}$",(3,8)); |
Dernière modification le Fri Oct 28 12:58:51 CEST 2011 par G.Marris Valide XHTML