COURBES DEFINIES PAR DES POINTS (ET TANGENTES) (12)
Liste des figures
Figure fig_aa01_050410_courbe_definie_par_points
figure 0001
Figure fig_aa02_050410_courbe_definie_par_points
figure 0002
Figure fig_aa03_050410_courbe_definie_par_points
figure 0003
Figure fig_aa04_150112_Spline_Straight
figure 0004
Figure fig_ab01_050410_courbe_definie_par_points
figure 0005
Figure fig_ab02_050410_courbe_definie_par_points
figure 0006
Figure fig_ab03_050410_courbe_definie_par_points
figure 0007
Figure fig_nu01_180213_nuage_de_points
figure 0008
Figure fig_pa01_020711_point_d_abscisse_a
figure 0009
Figure fig_ta01_050410_courbe_definie_par_points_tangentes
figure 0010
Figure fig_tb01_050410_courbe_definie_par_points_tangentes
figure 0011
Figure fig_tc01_121211_courbe_definie_par_points_tangentes
figure 0012
Asymptote - Figure 0001: fig_aa01_050410_courbe_definie_par_points.asy
(Code compilé avec Asymptote version 2.14svn)
largeur320 Figure fig_aa01_050410_courbe_definie_par_points
// guide graph(picture pic=currentpicture, 
//             real[] x, real[] y,
//             interpolate join=operator --);
//
// Returns a graph using the scaling information for picture pic of the 
// elements of the arrays (x,y), using the given interpolation type.

import graph;
size(7.5cm,0);

real[] x={ -3 , -2 ,  0 ,  2 ,  3 },
       y={  4 ,  3 , -2 ,  4 ,  3 };
                              
guide courbe=graph(x,y);

dot(courbe,3bp+blue);
draw(courbe,red);

xaxis("$x$",Ticks("%",end=false),Arrow());
yaxis("$y$",Ticks("%",end=false),Arrow());
Asymptote - Figure 0002: fig_aa02_050410_courbe_definie_par_points.asy
(Code compilé avec Asymptote version 1.95svn)
largeur320 Figure fig_aa02_050410_courbe_definie_par_points
// guide graph(picture pic=currentpicture, 
//             real[] x, real[] y,
//             interpolate join=operator --);
//
// Returns a graph using the scaling information for picture pic of the 
// elements of the arrays (x,y), using the given interpolation type.

import graph;
size(7.5cm,0);

real[] x={ -3 , -2 ,  0 ,  2 ,  3 },
       y={  4 ,  3 , -2 ,  4 ,  3 };
                              
guide courbe1=graph(x,y,join=operator ..); // tension = 1

// Si la tension de la courbe de Bézier (par défaut à 1)
// n'est pas satisfaisante, on peut l'augmenter
// et définir son propre opérateur de liaison.
tensionSpecifier t= operator tension(2,true);
interpolate operator ::=operator ..(t); //  tension = 2
guide courbe2=graph(x,y,join=operator ::);

dot(courbe1,3bp+blue);
draw(courbe1,red);
draw(courbe2,.7green+dashed);

xaxis("$x$",Ticks("%",end=false),Arrow());
yaxis("$y$",Ticks("%",end=false),Arrow());
Asymptote - Figure 0003: fig_aa03_050410_courbe_definie_par_points.asy
(Code compilé avec Asymptote version 1.95svn)
largeur320 Figure fig_aa03_050410_courbe_definie_par_points
// guide[] graph(picture pic=currentpicture, 
//               real[] x, real[] y,
//               bool3[] cond,
//               interpolate join=operator --);
//
// Returns a graph using the scaling information for picture pic of the 
// elements of the arrays (x,y), optionally restricted to those indices 
// for which the elements of the boolean array cond are true, using the 
// given interpolation type.

import graph;
size(7.5cm,0);

real[] x={ -3 , -2 ,  0 ,  2 ,  3 },
       y={  4 ,  3 , -2 ,  4 ,  3 };
                              
real a=2.5;
// TROIS SYNTAXES POSSIBLES POUR ECRIRE LA CONDITION :
// SYNTAXE 1
guide[] courbe=graph(x,y,y>a,join=operator ..);

// SYNTAXE 2
//     bool3[] condition=y>a;               
//     guide[] courbe=graph(x,y,condition,join=operator ..);

// SYNTAXE 3
//     bool3[] condition(real[] x, real[] y){
//         bool3[] cond=y>a;
//         return cond;
//     }                               
//     guide[] courbe=graph(x,y,condition(x,y),join=operator ..);

dot(pairs(x,y),5bp+green);
dot(courbe,3bp+blue);
draw(courbe,red);
draw((-3,a)--(3,a),dashed);

xaxis("$x$",Ticks("%",end=false),Arrow());
yaxis("$y$",Ticks("%",end=false),Arrow());

// Thanks to gk-v and jcbowman for their help.
Asymptote - Figure 0004: fig_aa04_150112_Spline_Straight.asy
(Code compilé avec Asymptote version 2.14svn)
largeur320 Figure fig_aa04_150112_Spline_Straight
import graph;
size(7.5cm,0);

real[] x={ -3 , -2   , 0 , 1 , 2 },
       y={ -2 , -1.5 , 3 , 4 , 4 };
                              
// Deux abréviations utiles : Spline et Straight (par défaut)
guide courbe1=graph(x,y,Straight), // join=operator --
      courbe2=graph(x,y,Spline);   // join=operator ..

dot(courbe1,3bp+blue);
draw(courbe1,red);
draw(courbe2,.5green+linetype("4 4"));

xaxis("$x$",Ticks("%",end=false),Arrow());
yaxis("$y$",Ticks("%",end=false),Arrow());
Asymptote - Figure 0005: fig_ab01_050410_courbe_definie_par_points.asy
(Code compilé avec Asymptote version 1.95svn)
largeur320 Figure fig_ab01_050410_courbe_definie_par_points
// guide graph(picture pic=currentpicture, 
//             pair[] z,
//             interpolate join=operator --);
//
// Returns a graph using the scaling information for picture pic of the 
// elements of the array z, using the given interpolation type.

import graph;
size(7.5cm,0);

pair[] z={(-3,4),(-2,3),(0,-2),(2,4),(3,3)};
                              
guide courbe=graph(z);

dot(z,3bp+blue);
draw(courbe,red);

xaxis("$x$",Ticks("%",end=false),Arrow());
yaxis("$y$",Ticks("%",end=false),Arrow());
Asymptote - Figure 0006: fig_ab02_050410_courbe_definie_par_points.asy
(Code compilé avec Asymptote version 1.95svn)
largeur320 Figure fig_ab02_050410_courbe_definie_par_points
// guide graph(picture pic=currentpicture, 
//             pair[] z,
//             interpolate join=operator --);
//
// Returns a graph using the scaling information for picture pic of the 
// elements of the array z, using the given interpolation type.

import graph;
size(7.5cm,0);

pair[] z={(-3,4),(-2,3),(0,-2),(2,4),(3,3)};
                              
guide courbe1=graph(z,join=operator ..), // tension = 1
      courbe2=graph(z,join=operator ..(operator tension(2,true)));

dot(z,3bp+blue);
draw(courbe1,red);
draw(courbe2,.7green+dashed);

xaxis("$x$",Ticks("%",end=false),Arrow());
yaxis("$y$",Ticks("%",end=false),Arrow());
Asymptote - Figure 0007: fig_ab03_050410_courbe_definie_par_points.asy
(Code compilé avec Asymptote version 1.95svn)
largeur320 Figure fig_ab03_050410_courbe_definie_par_points
// guide[] graph(picture pic=currentpicture, 
//               pair[] z,
//               bool3[] cond,
//               interpolate join=operator --);
//
// Returns a graph using the scaling information for picture pic of the 
// elements of the array z, optionally restricted to those indices for
// which the elements of the boolean array cond are true, using the given
// interpolation type.

import graph;
size(7.5cm,0);

pair[] z={(-3,4),(-2,3),(-1,3),(0,-2),(1,2.5),(2,3),(3,3)};

real a=2.5;                              
                              
bool3[] condition=abs(z)>a;
guide[] courbe=graph(z,condition,join=operator ..);

dot(z,5bp+green);
dot(courbe,3bp+blue);
draw(courbe,red);

draw(scale(a)*unitcircle,dashed);

xaxis("$x$",Ticks("%",end=false),Arrow());
yaxis("$y$",Ticks("%",end=false),Arrow());
Asymptote - Figure 0008: fig_nu01_180213_nuage_de_points.asy
(Code compilé avec Asymptote version 2.22svn-r5538)
largeur320 Figure fig_nu01_180213_nuage_de_points
import graph;
unitsize(.5cm,0.005cm);

real xmin=0,    xmax=12,   xstep=1;
real ymin=4800, ymax=6500, ystep=100;
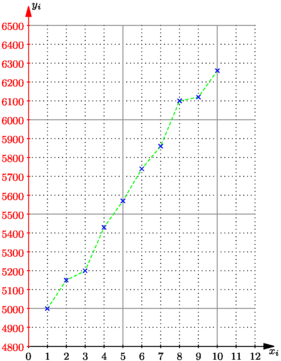
real[] xi={1,2,3,4,5,6,7,8,9,10};
int[]  yi={5000,5150,5200,5430,5570,5740,5860,6100,6120,6260};
path polygone=graph(xi,yi);
marker croix=marker(scale(2)*cross(4),.6bp+blue);
draw(polygone,green+linetype("4 4"),croix);

// La grille... sans les graduations !
xlimits(xmin,xmax);
ylimits(ymin,ymax);
pen pBord=nullpen,
    pGrille=.2mm+linetype("0 "+ string(1mm),offset=0,scale=false,adjust=false);
xaxis(BottomTop,pBord,Ticks("%",Step=5,    step=1,
                                pTick=gray,ptick=pGrille,
                            extend=true));
yaxis(LeftRight,pBord,Ticks("%",Step=500,  step=100,
                                pTick=gray,ptick=pGrille,
                            extend=true));
// Les axes
pen stylo=fontsize(8pt);
// axe horizontal d'équation y=4800
yequals(4800,xmin,xmax+xstep,stylo,
        Ticks(Size=1,end=false,endlabel=false,Step=xstep),
        Arrow);
// axe vertical d'équation x=0
xequals(0,   ymin,ymax+ystep,stylo+red,
        Ticks(Size=1,end=false,endlabel=false,Step=ystep),
        Arrow);

label("$x_i$",(xmax+xstep,ymin),S,stylo);
label("$y_i$",(xmin,ymax+ystep),E,stylo);
Asymptote - Figure 0009: fig_pa01_020711_point_d_abscisse_a.asy
(Code compilé avec Asymptote version 2.14svn)
largeur320 Figure fig_pa01_020711_point_d_abscisse_a
import graph;
import interpolate;
import geometry;
unitsize(1cm,2cm);

real[] xpt={-2,-1,0,2,6}; // discrétisation en x
real[] ypt={3,1,-.5,-.5,2}; // valeurs de la fonction aux instants de la discrétisation
real[] dy={-2,-1.5,-1,.5,.1}; // valeurs de la dérivée aux instants de la discrétisation
real f(real t){ return pwhermite(xpt,ypt,dy)(t); }
path Cf=graph(f,-2,6,n=13,operator=..);

draw(Cf, blue);
dot(Cf, 3bp+red);
for(int k=0; k<xpt.length; ++k) dot((xpt[k],ypt[k]),4bp+blue);

// Pour trouver un point de Cf d'abscisse choisie...
real a=5;
// ... on détermine son "time" sur le path Cf
real ti=(a-min(Cf).x)/(max(Cf).x-min(Cf).x)*length(Cf);
// ... pour pouvoir définir le point et le placer.
pair pM=point(Cf,ti);
draw((pM.x,0)--pM,linetype("4 4"));

DefaultHead=HookHead;
xaxis("$x$",xmin=-2,xmax=6.9,Ticks(NoZero,Step=1,Size=1),Arrow());
yaxis("$y$",ymin=-1,ymax=3.5,Ticks(NoZero,Step=1,Size=1),Arrow());

arrow(format("ti$=%f$",ti),pM,NW,1cm,red,Margin(0,0.5));
label("$0$",point(Cf,0),S,red);
label("$5$",point(Cf,5),S,red);
label("$10$",point(Cf,10),S,red);
Asymptote - Figure 0010: fig_ta01_050410_courbe_definie_par_points_tangentes.asy
(Code compilé avec Asymptote version 2.14svn)
largeur320 Figure fig_ta01_050410_courbe_definie_par_points_tangentes
import graph;
import interpolate;
import geometry;
size(10cm,0);

real[] xpt={-2,-1,0,1,2}; // discrétisation en x
real[] ypt={3,1,0,.5,2}; // valeurs de la fonction aux instants de la discrétisation
real[] dy={-1,0,-1,0,.5}; // valeurs de la dérivée aux instants de la discrétisation

real f(real t)
{ return pwhermite(xpt,ypt,dy)(t);
}
path Cf=graph(f,-2,2);
draw(Cf, blue);

void tangente(int k,real lg=1,real ld=lg, pen p=dashed, arrowbar arr=None) {
  draw(((xpt[k],ypt[k])-lg*unit((1,dy[k])))
       --((xpt[k],ypt[k])+ld*unit((1,dy[k]))),
       p,
       arr);
}
tangente(0,lg=0,ld=1,p=.5bp+red,Arrow(SimpleHead));
tangente(1);
tangente(2,lg=0.8,Arrows);
tangente(3,lg=.8,p=purple,Arrow);
tangente(4,lg=1,ld=0,p=.5bp+red,BeginArrow(HookHead));
Asymptote - Figure 0011: fig_tb01_050410_courbe_definie_par_points_tangentes.asy
(Code compilé avec Asymptote version 1.95svn)
largeur320 Figure fig_tb01_050410_courbe_definie_par_points_tangentes
import graph;

size(10cm,0);

real[] xpt={-1,.5,2,2.5,4};
real[] ypt={2,-1,2,-2,3};

real xmin=min(xpt)-.5,xmax=max(xpt)+.5;
real ymin=min(ypt)-.5,ymax=max(ypt)+.5;

marker croix=marker(scale(2)*rotate(45)*cross(4),1bp+red);

draw(graph(xpt,ypt,Hermite(monotonic)),croix);

void tanghoriz(int k,real lg=1,real ld=lg, pen p=dashed, arrowbar arr=None) {
  draw(((xpt[k]-lg,ypt[k]))--((xpt[k]+ld,ypt[k])),p,arr);
}

tanghoriz(1,lg=1.5,p=.5bp+red,Arrows(SimpleHead));
tanghoriz(2);

xaxis(Label("$x$",position=EndPoint, align=NE),
  xmin=xmin,xmax=xmax,
  Ticks(scale(.7)*Label(align=E),
  NoZero,
  Step=1,step=.25,Size=1mm, size=.5mm,
  pTick=black,ptick=gray),
  Arrow);
yaxis(Label("$y$",position=EndPoint, align=NE),
  ymin=ymin,ymax=ymax,
  Ticks(scale(.7)*Label(),
  NoZero,
  Step=1,step=.25,Size=1mm, size=.5mm,
  pTick=black,ptick=gray),
  Arrow);
Asymptote - Figure 0012: fig_tc01_121211_courbe_definie_par_points_tangentes.asy
(Code compilé avec Asymptote version 2.14svn)
largeur320 Figure fig_tc01_121211_courbe_definie_par_points_tangentes
// Standard cubic spline interpolation with clamped conditions f'(a), f'(b)
//         splinetype clamped(real slopea, real slopeb)

import graph;

size(10cm);

real[] x={0,2,4}, y={0,0,0};
path p[] = {graph(x,y,Hermite(clamped(5,5))),
            graph(x,y,Hermite(clamped(2,0))),
            graph(x,y,Hermite(clamped(-1,1)))};
int np = p.length;

pen coul[]={red,blue,green}; 
coul.cyclic=true; // pour ne pas avoir toujours à adapter le nombre
                  // de couleurs au nombre de chemins dans p, quand
                  // on effectue des tests.
for(int k=0; k<np; ++k){
  pen coulc = coul[k]+dashed,
      coult = .8*coul[k];
  draw(p[k],coulc);
  draw(point(p[k],0)--point(p[k],0)+dir(p[k],0),coult,Arrow());
  draw(relpoint(p[k],1)--relpoint(p[k],1)+reldir(p[k],1),coult,Arrow());
}
dot(p[0],2bp+blue);

Dernière modification le Tue Feb 19 09:28:14 CET 2013 par G.Marris       Valide XHTML