COURBES REPRESENTATIVES DE FONCTIONS (21)
Liste des figures
Figure fig_aa01_300109_fonction_carre
figure 0001
Figure fig_aa02_300109_fonction_carre
figure 0002
Figure fig_aa03_070209_fonction_carre
figure 0003
Figure fig_aa04_300109_fonction_carre
figure 0004
Figure fig_aa05_190208_fonction_carre
figure 0005
Figure fig_ab01_190208_fonction_inverse
figure 0006
Figure fig_ba01_200109_fonctions_associees
figure 0007
Figure fig_ba02_200109_fonctions_associees
figure 0008
Figure fig_ba03_160110_fonctions_associees
figure 0009
Figure fig_fa01_090308_fonctions_diverses
figure 0010
Figure fig_fa02_030410_fonctions_diverses
figure 0011
Figure fig_fa03_131111_fonction_partie_entiere
figure 0012
Figure fig_ga01_100509_graduations
figure 0013
Figure fig_ha01_120308_aire_sous_courbe
figure 0014
Figure fig_ha02_210508_aire_entre_courbes
figure 0015
Figure fig_ia01_150210_fonction_intervalle
figure 0016
Figure fig_pp01_290410_points_particuliers
figure 0017
Figure fig_pp02_290410_points_particuliers
figure 0018
Figure fig_ra01_120308_somme_riemann
figure 0019
Figure fig_ta01_060211_tangentes_en_utilisant_dir
figure 0020
Figure fig_za01_101109_zoom_sur_une_zone
figure 0021
Asymptote - Figure 0001: fig_aa01_300109_fonction_carre.asy
(Code compilé avec Asymptote version 2.22svn-r5538)
largeur320 Figure fig_aa01_300109_fonction_carre
import graph;

size(10cm,0);

real xmin=-3,xmax=3;
real ymin=-1,ymax=9.5;

// Définition de la fonction
real f(real x) {return x^2;}

// Tracé de la courbe
path Cf=graph(f,xmin,xmax,n=400);
draw(Cf,linewidth(1bp));

xaxis(Label("$x$",align=Align),xmax=3.4,Ticks(NoZero),Arrow);
yaxis(Ticks(NoZero));

shipout(bbox(2mm,Fill(white)));
Asymptote - Figure 0002: fig_aa02_300109_fonction_carre.asy
(Code compilé avec Asymptote version 2.09svn)
largeur320 Figure fig_aa02_300109_fonction_carre
import graph;

size(10cm,0);

real xmin=-4,xmax=4;
real ymin=-2,ymax=10;

// Définition de la fonction
real f(real x) {return x^2;}

// Construction de points sous forme de croix
path Cf1=graph(f,xmin,xmax,n=16);
marker cross=marker(scale(4)*rotate(45)*cross(4),1bp+red);
cross.mark(Cf1); 

// Définition et construction de la courbe
path Cf2=graph(f,xmin,xmax,n=400);
draw(Cf2,linewidth(1bp));

ylimits(-2.5,10,Crop);

xaxis(Label("$x$",position=EndPoint, align=NE),
      xmin=xmin,xmax=xmax,
      Ticks(scale(.7)*Label(align=E),
            NoZero,
            begin=false,beginlabel=false,
            end=false,endlabel=false,
            Step=1,step=.25,
            Size=1mm, size=.5mm,
            pTick=black,ptick=gray),
            Arrow);

yaxis(Label("$y$",position=EndPoint, align=NE),
      ymin=ymin,ymax=ymax,
      Ticks(scale(.7)*Label(),
            NoZero,
            begin=false,beginlabel=false,
            end=false,endlabel=false,
            Step=1,step=.25,
            Size=1mm, size=.5mm,
            pTick=black,ptick=gray),
      Arrow);

shipout(bbox(2mm,Fill(white)));
Asymptote - Figure 0003: fig_aa03_070209_fonction_carre.asy
(Code compilé avec Asymptote version 2.09svn)
largeur320 Figure fig_aa03_070209_fonction_carre
// Dans cet exemple, les points sont régulièrement espacés 
// sur la courbe mais ils ne correspondent plus nécessairement
// à des abscisses entières ou semi-entières.

import graph;

size(10cm,0); 
 
real xmin=-4,xmax=4; 
real ymin=-2,ymax=10; 
 
// Définition de la fonction 
real f(real x) {return x^2;} 
 
marker croix=marker(scale(4)*rotate(45)*cross(4),markuniform(21),1bp+red); 
 
// Définition et construction de la courbe 
draw(graph(f,xmin,xmax,n=400),linewidth(1bp),croix); 
 
ylimits(-2.5,10,Crop); 
 
xaxis(Label("$x$",position=EndPoint, align=NE), 
      xmin=xmin,xmax=xmax, 
      Ticks(scale(.7)*Label(align=E), 
          NoZero, 
          begin=false,beginlabel=false, 
          end=false,endlabel=false, 
          Step=1,step=.25, 
          Size=1mm, size=.5mm, 
          pTick=black,ptick=gray), 
      Arrow); 
 
yaxis(Label("$y$",position=EndPoint, align=NE), 
      ymin=ymin,ymax=ymax, 
      Ticks(scale(.7)*Label(), 
          NoZero, 
          begin=false,beginlabel=false, 
          end=false,endlabel=false, 
          Step=1,step=.25, 
          Size=1mm, size=.5mm, 
          pTick=black,ptick=gray), 
      Arrow); 
 
shipout(bbox(2mm,Fill(white))); 
Asymptote - Figure 0004: fig_aa04_300109_fonction_carre.asy
(Code compilé avec Asymptote version 2.09svn)
largeur320 Figure fig_aa04_300109_fonction_carre
import graph;

unitsize(1cm,.5cm);

real xmin=-4,xmax=4;
real ymin=-2,ymax=10;

// Définition de la fonction
real f(real x) {return x^2;}

// Tracé de la courbe
path Cf=graph(f,xmin,xmax,n=400);
draw(Cf,linewidth(1bp));
xlimits(-4.5,4.5,Crop);
ylimits(-2.5,10,Crop);

xaxis(Label("$x$",position=EndPoint, align=NE),
      xmin=xmin,xmax=xmax,
      Ticks(scale(.7)*Label(align=E),
            NoZero,
            begin=false,beginlabel=false,
            end=false,endlabel=false,
            Step=1,step=.25,
            Size=1mm, size=.5mm,
            pTick=blue,ptick=gray),
            Arrow);

yaxis(Label("$y$",position=EndPoint, align=NE),
      ymin=ymin,ymax=ymax,
      Ticks(scale(.7)*Label(),
            NoZero,
            begin=false,beginlabel=false,
            end=false,endlabel=false,
            Step=1,step=.5,
            Size=1mm, size=.5mm,
            pTick=blue,ptick=gray),
      Arrow);

shipout(bbox(1cm,Fill(white)));
Asymptote - Figure 0005: fig_aa05_190208_fonction_carre.asy
(Code compilé avec Asymptote version 2.09svn)
largeur320 Figure fig_aa05_190208_fonction_carre
import graph_pi;
usepackage("mathrsfs");

size(10cm,0);

graphicrules(xunit=1cm, yunit=1cm,
             xmin=-4, xmax=4,
             ymin=-2, ymax=10,
             crop=Crop
             );
grid(xStep=1, xstep=.5,
     yStep=1, ystep=.5,
     pTick=.8red,
     ptick=dotted+.7bp+.4white,
     above=false
     );
cartesianaxis(
       p=currentpen,
       xticks=RightTicks(Label(currentpen+fontsize(8),
                               Fill(white)),
                         Step=2,
                         NoZero,
                         pTick=.5mm+blue,ptick=grey),
       yticks=RightTicks(Label(currentpen+fontsize(8),
                               align=NE),
                         Step=2,
                         NoZero,
                         pTick=.5mm+blue,ptick=grey),
       viewxaxis=true,
       viewyaxis=true,
       above=true,
       arrow=Arrow
       );
labeloij(p=1.4bp+.5*red,
         arrow=Arrow(SimpleHead,8bp),
         dot
         );
// Définition de la fonction
real f(real x) {return x^2;}

// Tracé de la courbe
path Cf=graph(f,n=400);
draw(Cf,linewidth(1bp));
xlimits(-4.5,4.5,Crop);
ylimits(-2.5,10.5,Crop);
label("$\mathscr{C}_f$",(3,f(3)),NW);
Asymptote - Figure 0006: fig_ab01_190208_fonction_inverse.asy
(Code compilé avec Asymptote version 2.09svn)
largeur320 Figure fig_ab01_190208_fonction_inverse
import graph_pi;
usepackage("mathrsfs");
size(10cm,0);

graphicrules(xunit=1cm, yunit=1cm, 
             xmin=-4, xmax=4, 
             ymin=-4, ymax=4, 
             crop=Crop
             );
grid(xStep=1, xstep=.5,
     yStep=1, ystep=.5,
     pTick=.8red, 
     ptick=dotted+.7bp+.4white,
     above=false
     );
cartesianaxis(
       p=currentpen,
       xticks=Ticks(Label(Fill(white)),
                    Step=2,
                    NoZero,
                    pTick=.5mm+blue,ptick=grey),
       yticks=Ticks(Label(Fill(white),
                          align=NE),
                    Step=2,
                    NoZero,
                    pTick=.5mm+blue,ptick=grey),
       viewxaxis=true,
       viewyaxis=true,
       above=true,
       arrow=Arrow
       );
labeloij(p=1.4bp+.5*red,
         arrow=Arrow(SimpleHead,8bp),
         dot
         );
// Définition de la fonction
real f(real x) {return 1/x;}
// Tracé de la courbe
path Cf1=graph(f,-5,-0.001,n=200);
path Cf2=graph(f,0.001,5,n=200);
draw(Cf1,dashed+1bp);
draw(Cf2,linewidth(1bp));
xlimits(-4.5,4.5,Crop);
ylimits(-4.5,4.5,Crop);         
label("$\mathscr{C}_f$",(.4,f(.4)),NE);
Asymptote - Figure 0007: fig_ba01_200109_fonctions_associees.asy
(Code compilé avec Asymptote version 2.09svn)
largeur320 Figure fig_ba01_200109_fonctions_associees
import graph_pi;
import patterns;
usepackage("mathrsfs");
size(10cm,0);
graphicrules(xunit=1cm, yunit=1cm,
             xmin=-2, xmax=6,
             ymin=-2, ymax=10,
             crop=Crop
             );
// Définition et tracé de la grille
grid(xStep=1, xstep=.5,
     yStep=1, ystep=.5,
     pTick=.7bp+.7white, 
     ptick=.7bp+dotted+.7white,
     above=false
     );
// Définition et tracé des axes
cartesianaxis(
    xticks=Ticks(Label(Fill(white)),
                 Step=1, step=.5,
                 NoZero,
                 ptick=grey),
    yticks=Ticks(Label(Fill(white)),
                 Step=2, step=1,
                 NoZero,
                 ptick=grey),
    Arrow
    );
real a=3, b=1;
// Définition des fonctions
real u(real x) {return x^3;}
real f(real x) {return u(x-a)+b;} // voir exemple suivant pour une variante
// Tracé des courbes
path Cu=graph(u,-2,3,n=400);
path Cf=graph(f,-2+a,3+a,n=400);
draw(Cu,linewidth(1bp)+dashed+blue);
draw(Cf,linewidth(1bp)+blue);
xlimits(-2.5,7,Crop);
ylimits(-2.5,11,Crop);
// Ajout des noms de courbes, d'un repère.
label("$\mathscr{C}_u$",(1.5,u(1.5)),NW);
label("$\mathscr{C}_f$",(1.5+a,f(1.5+a)),NW);  
labeloij(p=1.4bp+.5*red,
         arrow=Arrow(SimpleHead,8bp),
         dot
         );
// Des réprésentants du vecteur de la translation   
for(int k=-1; k<3; ++k) draw((k,u(k))--(k+3,f(k+3)),red,Arrow);
real k=1.5;
draw((k,u(k))--(k+3,f(k+3)),red,Arrow);
Asymptote - Figure 0008: fig_ba02_200109_fonctions_associees.asy
(Code compilé avec Asymptote version 2.09svn)
largeur320 Figure fig_ba02_200109_fonctions_associees
// Une variante de l'exemple précédent
// où, cette fois, plutôt que de définir la fonction f
// on définit une translation t que l'on exploite 
// pour les constructions.

import graph_pi;
import patterns;
usepackage("mathrsfs");
size(10cm,0);
graphicrules(xunit=1cm, yunit=1cm,
             xmin=-2, xmax=6,
             ymin=-2, ymax=10,
             crop=Crop
             );
// Définition et tracé de la grille
grid(xStep=1, xstep=.5,
     yStep=1, ystep=.5,
     pTick=.7bp+.7white, 
     ptick=.7bp+dotted+.7white,
     above=false
     );
// Définition et tracé des axes
cartesianaxis(
    xticks=Ticks(Label(Fill(white)),
                 Step=1, step=.5,
                 NoZero,
                 ptick=grey),
    yticks=Ticks(Label(Fill(white)),
                 Step=2, step=1,
                 NoZero,
                 ptick=grey),
    Arrow
    );
// On définit une translation t de vecteur (a,b)
real a=3, b=1;
transform t=shift(a,b);
// Définition de la fonction u et de sa courbe
real u(real x) {return x^3;}
path Cu=graph(u,-2,3,n=400);
// La courbe Cf s'en déduit par la translation t
path Cf=t*Cu;
// On trace les courbes.
draw(Cu,linewidth(1bp)+dashed+blue);
draw(Cf,linewidth(1bp)+blue);
xlimits(-2.5,7,Crop);
ylimits(-2.5,11,Crop);
// Ajout des noms de courbes, d'un repère.
real k=1.5;
label("$\mathscr{C}_u$",(k,u(k)),NW);
label("$\mathscr{C}_f$",t*(k,u(k)),NW);  
labeloij(p=1.4bp+.5*red,
         arrow=Arrow(SimpleHead,8bp),
         dot
         );
// Des réprésentants du vecteur de la translation   
for(int k=-1; k<3; ++k) draw((k,u(k))--t*(k,u(k)),red,Arrow);
k=1.5;
draw((k,u(k))--t*(k,u(k)),red,Arrow);
Asymptote - Figure 0009: fig_ba03_160110_fonctions_associees.asy
(Code compilé avec Asymptote version 2.09svn)
largeur320 Figure fig_ba03_160110_fonctions_associees
import graph;

size(10cm,0);

real xmin=-4,xmax=4;
real ymin=-6,ymax=7;

real a=1, b, c=-1;

pen[] couleurs={red,blue,green};

// Définition de la fonction
real f(real x) {return a*x^2+b*x+c;}

// Construction de points sous forme de croix
path Cf1=graph(f,xmin,xmax,n=16);
marker cross=marker(scale(2)*rotate(45)*cross(4),1bp+red);
cross.mark(Cf1); 

// Définition et construction de la famille de paraboles
for(int b=-4;b<5;++b){
real f(real x) {return a*x^2+b*x+c;}
path Cf2=graph(f,xmin,xmax,n=400);
draw(Cf2,linewidth(1bp)+couleurs[b%couleurs.length]);
dot((-b/2a,f(-b/2a)),3bp+gray);
if(b!=0) label(scale(.6)*format("$b=%i$",b),(.95(-b/2a-sgn(a*b)),f(-b/2a)),
               couleurs[b%couleurs.length]);
}

// Définition et construction de la parabole des sommets
real g(real x) {return c-a*x^2;}
path Cg=graph(g,xmin,xmax,n=400);
draw(Cg,linewidth(1bp)+dotted);

ylimits(ymin,ymax,Crop);

xaxis(Label("$x$",position=EndPoint, align=NE),
      xmin=xmin,xmax=xmax,
      Ticks(scale(.7)*Label(align=E),
            NoZero,
            begin=false,beginlabel=false,
            end=false,endlabel=false,
            Step=1,step=.25,
            Size=1mm, size=.5mm,
            pTick=black,ptick=gray),
            Arrow);

yaxis(Label("$y$",position=EndPoint, align=NE),
      ymin=ymin,ymax=ymax,
      Ticks(scale(.7)*Label(),
            NoZero,
            begin=false,beginlabel=false,
            end=false,endlabel=false,
            Step=1,step=.25,
            Size=1mm, size=.5mm,
            pTick=black,ptick=gray),
      Arrow);

label("$a=1$, $c=-1$ - Incidence de $b$ ?",truepoint(N),N);
label("$f:x\mapsto ax^2+bx+c$",truepoint(N),N);
          
shipout(bbox(2mm,Fill(white)));
Asymptote - Figure 0010: fig_fa01_090308_fonctions_diverses.asy
(Code compilé avec Asymptote version 2.09svn)
largeur320 Figure fig_fa01_090308_fonctions_diverses
import graph_pi;
usepackage("mathrsfs");

size(10cm,0);

graphicrules(xunit=.8cm, yunit=1.5cm,
             xmin=-3pi/2, xmax=pi/2,
             ymin=-3, ymax=3,
             crop=Crop
             );
// Définition et tracé de la grille
grid(xStep=pi/4, xstep=pi/12,
     yStep=1, ystep=.5,
     pTick=.7bp+.7white, 
     ptick=.7bp+dotted+.7white,
     above=false
     );
// Définition et tracé des axes
cartesianaxis(
    xticks=Ticks(Label(Fill(white)),
                 labelfrac(factor=pi,
                           symbol="\pi",
                           symbolin=true,
                           zero=false),
                 Step=pi/2, step=pi/12,
                 ptick=grey),
    yticks=Ticks(Label(Fill(white)),
                 labelfrac(zero=false),
                 Step=2, step=1,
                 ptick=grey),
    Arrow
    );
// Définition des fonctions
real f(real x) {return exp(x);}
real g(real x) {return cos(x);}
real h(real x) {return f(x)*g(x);}
 
// Tracé des courbes
path Cf=graph(f,-7,2,n=400);
path Cg=graph(g,-7,2,n=400);
path Ch=graph(h,-7,2,n=400);
draw(Cf,linewidth(1bp));
draw(Cg,linewidth(1bp)+blue);
draw(Ch,linewidth(1bp)+red);
xlimits(-5,2,Crop);
ylimits(-3.2,3.4,Crop);
label("$\mathscr{C}_f$",(1,f(1)),E);  
label("$\mathscr{C}_g$",(-2.8,g(-2.8)),S);    
label("$\mathscr{C}_h$",(1.9,h(1.9)),W);   
Asymptote - Figure 0011: fig_fa02_030410_fonctions_diverses.asy
(Code compilé avec Asymptote version 2.09svn)
largeur320 Figure fig_fa02_030410_fonctions_diverses
import graph;
unitsize(1cm); 

real xmin=-4,xmax=4; 
real ymin=-4,ymax=4; 

real f(real x) {return log((3+x)/(3-x));}

marker cross=marker(scale(4)*rotate(45)*cross(4),1bp+red);
cross.mark(graph(f,-2.5,2.5,n=10)); 

draw(graph(f,-2.99,2.99,n=400),linewidth(1bp)); 

ylimits(-5,5,Crop); 
xaxis(Label("$x$",position=EndPoint, align=NE), 
      xmin=xmin,xmax=xmax, 
      Ticks(scale(.7)*Label(align=E), 
          NoZero, 
          begin=false,beginlabel=false, 
          end=false,endlabel=false, 
          Step=1,step=.25, 
          Size=1mm, size=.5mm, 
          pTick=black,ptick=gray), 
      Arrow); 
yaxis(Label("$y$",position=EndPoint, align=NE), 
      ymin=ymin,ymax=ymax, 
      Ticks(scale(.7)*Label(), 
          NoZero, 
          begin=false,beginlabel=false, 
          end=false,endlabel=false, 
          Step=1,step=.25, 
          Size=1mm, size=.5mm, 
          pTick=black,ptick=gray), 
      Arrow); 
real a=-2.95;
label("$f:x\mapsto\displaystyle\ln\left(\frac{3+x}{3-x}\right)$",(a,f(a)),E);
Asymptote - Figure 0012: fig_fa03_131111_fonction_partie_entiere.asy
(Code compilé avec Asymptote version 2.14svn)
largeur320 Figure fig_fa03_131111_fonction_partie_entiere
usepackage("amsmath");
import graph;
size(8cm,0);

real Floor(real x) {return floor(x);}

pair[] ListeDesPointsCompris;
pair[] ListeDesPointsExclus;

//==================
// bool3 est un booléen à trois états : true, default et false
bool3 TestRelierOuPas(real x) {
  static real lasty;
  static bool first = true;
  real y = floor(x);
  bool memebranche = first || lasty == y;
  first = false;
  if(!memebranche) { ListeDesPointsExclus.push((x,lasty));
                     ListeDesPointsCompris.push((x,y));
                   }
  lasty=y;
  return memebranche ? true : default;
};
//==================

draw(graph(Floor,-5.5,5.5,500,TestRelierOuPas));
axes("$x$",rotate(0)*"$\lfloor x\rfloor$",red);

dot(ListeDesPointsCompris);
dot(ListeDesPointsExclus,UnFill);
Asymptote - Figure 0013: fig_ga01_100509_graduations.asy
(Code compilé avec Asymptote version 2.09svn)
largeur320 Figure fig_ga01_100509_graduations
import graph; 
 
size (7cm,0); 

real a=-1, b=-.1, c=1.5;
real f(real x) {return (x-a)*(x-b)*(x-c);}
draw(graph(f,b-.5,c+.3)); 

xaxis (Ticks("%", new real[]{a,b,0,1,c},Size=1mm,1bp+red)); 
labelx("$b$",b,SW);
labelx(0,1.5N);
labelx(1,1.5N);
labelx("$c$",c,SE);
Asymptote - Figure 0014: fig_ha01_120308_aire_sous_courbe.asy
(Code compilé avec Asymptote version 2.14svn)
largeur320 Figure fig_ha01_120308_aire_sous_courbe
import graph_pi;
import patterns;
usepackage("mathrsfs");

size(10cm,0);

graphicrules(xunit=1cm, yunit=1cm,
             xmin=-2, xmax=4,
             ymin=-1, ymax=5 //,crop=Crop
             );
// Définition et tracé de la grille
grid(xStep=1, xstep=.5,
     yStep=1, ystep=.5,
     pTick=.7bp+.7white, 
     ptick=.7bp+dotted+.7white,
     above=false
     );
// Définition et tracé des axes
cartesianaxis(
    xticks=Ticks(Label(Fill(white)),
                 Step=1, step=.5,
                 NoZero,
                                 ptick=grey),
    yticks=Ticks(Label(Fill(white)),
                 Step=2, step=1,
                 NoZero,
                 ptick=grey),
    Arrow
    );
// Définition de la fonction
real f(real x) {return 4-(x-1)^2;}
 
// Les hachures.
path zonehachuree=buildcycle((3,0)--(0,0)--(0,3),graph(f,0,3));
add("hachure",hatch(H=3mm,dir=NE,red));
fill(zonehachuree,pattern("hachure"));

// Tracé de courbe
path Cf=graph(f,-3,5,n=400);
draw(Cf,linewidth(1bp)+blue);
xlimits(-2.5,4.5,Crop);
ylimits(-1.5,5.5,Crop);
label("$\mathscr{C}_f$",(1,f(1)),NE);  

labeloij(p=1.4bp+.5*red,
         arrow=Arrow(SimpleHead,8bp),
         dot
         );
Asymptote - Figure 0015: fig_ha02_210508_aire_entre_courbes.asy
(Code compilé avec Asymptote version 2.14svn)
largeur320 Figure fig_ha02_210508_aire_entre_courbes
import graph_pi;
import patterns;
usepackage("mathrsfs");

size(10cm,0);

graphicrules(xunit=1cm, yunit=1cm,
             xmin=-1, xmax=4,
             ymin=-3, ymax=3  //, crop=Crop
             );
// Définition et tracé de la grille
grid(xStep=1, xstep=.5,
     yStep=1, ystep=.5,
     pTick=.7bp+.7white, 
     ptick=.7bp+dotted+.7white,
     above=false
     );
// Définition et tracé des axes
cartesianaxis(
    xticks=Ticks(Label(Fill(white)),
                 Step=1, step=.5,
                 NoZero,
                                 ptick=grey),
    yticks=Ticks(Label(Fill(white)),
                 Step=2, step=1,
                 NoZero,
                 ptick=grey),
    Arrow
    );
// Définition des fonctions
real f(real x) {return 2x-x^2;}
real g(real x) {return x;}
 
// Les hachures.
path zonehachuree=buildcycle(graph(f,0,3),(3,-5)--(3,5),graph(g,3,0));
add("hachure",hatch(H=1mm,dir=SE,lightgray));
fill(zonehachuree,pattern("hachure"));

// Tracé de courbe
path Cf=graph(f,-1.5,4.5,n=400);
path Cg=graph(g,-1.5,4.5,n=400);
draw(Cf,1bp+blue);
draw(Cg,dashed+1bp+red);
xlimits(-1.5,4.5,Crop);
ylimits(-3.5,3.5,Crop);
label("$\mathscr{C}_f$",(2.5,f(2.5)),SW,blue);
label("$\mathscr{C}_g$",(2.5,g(2.5)),NW,red);  

labeloij(p=1.4bp+.5*red,
         arrow=Arrow(SimpleHead,8bp),
         dot
         );
Asymptote - Figure 0016: fig_ia01_150210_fonction_intervalle.asy
(Code compilé avec Asymptote version 2.22svn-r5538)
largeur320 Figure fig_ia01_150210_fonction_intervalle
// OG.asy est, comme son nom l'indique, un fichier de contributions d'O.G..
// téléchargeable ici : OG.asy

import graph;
import OG; // pour profiter de "Bras" : extrémités de segment en forme de crochets. 
   
size(8cm,0);

real f (real x)
  {
  return cos(x);
  }

ylimits(-.3,1.5);
xaxis("$x$",EndArrow);
yaxis("$y$",EndArrow);

draw(graph(f,-.5,2,operator ..));

real x0=1;
real delta=.4;

path hline1=(x0-delta,0)--graph(f,x0-delta,x0+delta)--(x0+delta,0)--cycle,
     hline2=(0,f(x0-delta))--graph(f,x0-delta,x0+delta)--(0,f(x0+delta))--cycle;

fill(hline1^^hline2,palegreen+opacity(.95));
draw(hline1^^hline2,blue);

draw((x0-delta,0)--(x0+delta,0),blue+bp,Bras); //
draw((0,f(x0+delta))--(0,f(x0-delta)),blue+bp,Bras);
draw(graph(f,x0-delta,x0+delta),1.5bp+red,Bras);
Asymptote - Figure 0017: fig_pp01_290410_points_particuliers.asy
(Code compilé avec Asymptote version 2.09svn)
largeur320 Figure fig_pp01_290410_points_particuliers
import graph; 

size (8cm,0); 

real f(real x) {return (x^3-3x^2-x+2)/3;}
path Cf=graph(f,-1.6,3.5); 
draw(Cf);

// real dirtime(path p, pair z);
// returns the first "time", a real number between 0 and the length of
// the path in the sense of point(path, real), at which the tangent
// to the path has the direction of pair z, or -1 if this never happens.

real tA=dirtime(Cf,(1,0)); // le "time" du premier point du path 
                           // dont la tangente est dans la direction (1,0).
pair pA=point(Cf,tA);      // et le point correspondant du path
dot(pA,4bp+red);           // que l'on dessine en rouge.

// on procède de la même manière avec le path orienté dans l'autre sens
// pour trouver le second point bleu.
real tB=dirtime(reverse(Cf),(-1,0));
pair pB=point(reverse(Cf),tB);
dot(pB,4bp+blue);

draw(pA--pA+(1,0),grey,Arrow);
draw(pB--pB+(-1,0),grey,Arrow);

xaxis(Label("$x$",position=EndPoint, align=NE),
      Ticks(scale(.7)*Label(),NoZero,Size=.8mm, size=.4mm));
yaxis(Label("$y$",position=EndPoint, align=NE),
      Ticks(scale(.7)*Label(),NoZero,Size=.8mm, size=.4mm));
          
label("Utilisation de dirtime",truepoint(SE),NW);         
Asymptote - Figure 0018: fig_pp02_290410_points_particuliers.asy
(Code compilé avec Asymptote version 2.09svn)
largeur320 Figure fig_pp02_290410_points_particuliers
import graph; 

size (8cm,0); 

real f(real x) {return (x^3-3x^2-x+2)/3;}
path Cf=graph(f,-1.6,3.5); 
draw(Cf);

// real dirtime(path p, pair z);
// returns the first "time", a real number between 0 and the length of
// the path in the sense of point(path, real), at which the tangent
// to the path has the direction of pair z, or -1 if this never happens.

real tA=dirtime(Cf,(1,0)); // le "time" du premier point du path 
                           // dont la tangente est dans la direction (1,0).
pair pA=point(Cf,tA);      // et le point correspondant du path
dot(pA,4bp+red);           // que l'on dessine en rouge.

// On définit le path correspondant à la partie de Cf débutant au point rouge.
path Cf2=subpath(Cf,tA,reltime(Cf,1));

// Une autre façon de trouver le point bleu avec la fonction :
// real[] mintimes(path p)
// returns an array of length 2 containing times at which path p
// reaches its minimal horizontal and vertical extents, respectively.
pair pB=point(Cf2,mintimes(Cf2)[1]); 

draw(Cf2,1bp+red);
dot(pB,4bp+blue);

draw(pA--pA+(1,0),grey,Arrow);

xaxis(Label("$x$",position=EndPoint, align=NE),
      Ticks(scale(.7)*Label(),NoZero,Size=.8mm, size=.4mm));
yaxis(Label("$y$",position=EndPoint, align=NE),
      Ticks(scale(.7)*Label(),NoZero,Size=.8mm, size=.4mm));
          
label("dirtime/reltime/mintimes",truepoint(SE),NW);       
Asymptote - Figure 0019: fig_ra01_120308_somme_riemann.asy
(Code compilé avec Asymptote version 2.09svn)
largeur320 Figure fig_ra01_120308_somme_riemann
import graph_pi;
import patterns;
usepackage("mathrsfs");
usepackage("icomma");

size(10cm,0);

graphicrules(xunit=1cm, yunit=8cm,
             xmin=-1, xmax=8,
             ymin=-.2, ymax=1.2,
             crop=Crop
             );
// Définition et tracé de la grille
grid(xStep=1, xstep=.5,
     yStep=.2, ystep=.1,
     pTick=.7bp+.7white, 
     ptick=.7bp+dotted+.7white,
     above=false
     );
// Définition et tracé des axes
cartesianaxis(
    xticks=Ticks(Label(Fill(white)),
                 Step=1, step=.5,
                 NoZero,
                                 ptick=grey),
    yticks=Ticks(Label(Fill(white)),
                 Step=.2, step=.1,
                 NoZero,
                 ptick=grey),
    Arrow
    );
// Définition de la fonction
real f(real x) {return 1/x^2;}
 
// Les rectangles
int a=1, b=8;
for(int i=a; i <= b; ++i) {
  if(i < b) filldraw(box((i,f(i)),(i+1,0)),lightgray);
  dot((i,f(i)));
} 
// Les hachures.
path zonehachuree=buildcycle((8,1)--(8,0)--(1,0)--(1,1),graph(f,1,8));
add("hachure",hatch(H=3mm,dir=NE,red));
fill(zonehachuree,pattern("hachure"));

// Tracé de courbe
path Cf=graph(f,.5,8,n=400);
draw(Cf,linewidth(1bp)+blue);
xlimits(-1.5,8.5,Crop);
ylimits(-.3,1.3,Crop);
label("$\mathscr{C}_f : y=\displaystyle\frac{1}{x^2}$",(1,f(1)),NE);  

labeloij(p=1.4bp+.5*red,
         arrow=Arrow(SimpleHead,8bp),
         dot
         );
                 
arrow("$\displaystyle\int_{1}^{+\infty}\left(\frac{1}{x^2}\right)$d$x=1$",
          (3.5,0.05),NE,1.5cm,red,Margin(0,0.5));
arrow("$\displaystyle\sum_{k=1}^{+\infty}\left(\frac{1}{k^2}\right)
           =\frac{\pi^2}{6}$",(1.5,0.8),E,1.5cm,blue,Margin(0,0.5));      
Asymptote - Figure 0020: fig_ta01_060211_tangentes_en_utilisant_dir.asy
(Code compilé avec Asymptote version 2.09svn)
largeur320 Figure fig_ta01_060211_tangentes_en_utilisant_dir
import base_pi;
// base_pi téléchargeable ici : base_pi de Ph.Ivaldi
// extension utilisée pour texfrac : permettant de graduer l'axe des
// abscisses en fonction de pi.

import graph;

size(10cm,0);

real f(real x) { return x*sin(x); }

path Cf=graph(f,0,2pi,n=4000); // 4000 pour des tangentes plus précises.

draw(Cf);

xaxis(Ticks(Label(align=W,Fill(white)),NoZero,
      ticklabel = new string(real x){return texfrac(rational(x/pi), factor="\pi");},
      Step=pi/2, step=pi/4, ptick=grey),Arrow);
yaxis(ymin=-5.4,ymax=2.4,Ticks(NoZero),Arrow);

// Les deux tangentes... avec une méthode spécifique au fait
// qu'elles sont en deux points simples :
// celui de début et celui de fin de path fin de "path".
pair pA=relpoint(Cf,0), pB=relpoint(Cf,1);
draw(pA--pA+3*dir(Cf,0),blue,Arrow);
draw(pB--pB-3*dir(Cf,length(Cf)),blue,Arrow);
Asymptote - Figure 0021: fig_za01_101109_zoom_sur_une_zone.asy
(Code compilé avec Asymptote version 2.09svn)
largeur320 Figure fig_za01_101109_zoom_sur_une_zone
import graph_pi;
usepackage("mathrsfs");
unitsize(1cm,0);

pen pointille=linetype("0 " + string(1mm), offset=0, scale=false, adjust=false);

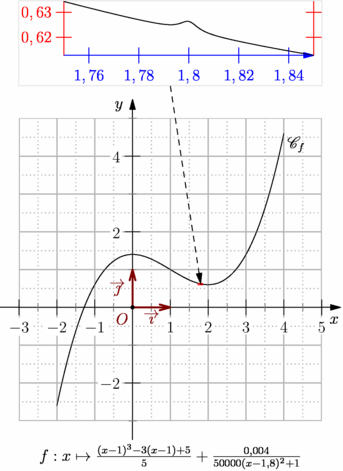
real f(real x) {return ((x-1)**3-3*(x-1)+5)/5+0.004/(50000*(x-1.8)**2+1);}
pair F(real x) {return (x,f(x));}

graphicrules(xunit=1cm, yunit=1cm,
             xmin=-3, xmax=5,
             ymin=-3, ymax=5,
             crop=Crop
             );
grid(xStep=1, xstep=.5,
     yStep=1, ystep=.5,
     pTick=.7bp+.7white, 
     ptick=.7bp+pointille+.7white,
     above=false
     );
// Définition et tracé des axes
cartesianaxis(
    xticks=Ticks(Label(Fill(white)),
                 Step=1, step=.5,
                 NoZero,
                 ptick=grey),
    yticks=Ticks(Label(Fill(white)),
                 Step=2, step=1,
                 NoZero,
                 ptick=grey),
    Arrow
    );

draw(graph(f,-2,4,1000));
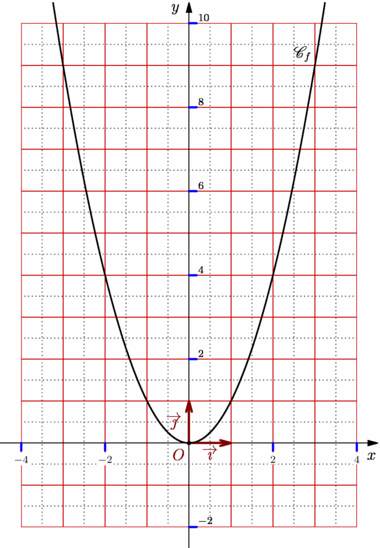
label("$\mathscr{C}_f$",F(4),SE);
xlimits(-3.5,5.5,Crop);
ylimits(-3.5,5.5,Crop);
labeloij(p=1.2bp+.5*red,
         arrow=Arrow(SimpleHead,8bp),
         dot
         );

picture pic;
size(pic,8cm);
draw(pic,graph(pic,f,1.75,1.85,1000));
xaxis(pic,Bottom(),xmin=1.75,xmax=1.85,blue,Ticks(Step=0.02),Arrow);
yaxis(pic,LeftRight(),red,Ticks(Step=0.01));


add(new void(frame f, transform t) {
    frame G=shift(point(f,N))*align(bbox(pic,lightgray),10N);
    add(f,G);
    draw(f,t*box(min(pic,user=true),max(pic,user=true)),red);
    draw(f,point(G,S)--t*point(pic,N),dashed,Arrow);
  });
label("$f:x\mapsto \frac{(x-1)^3-3(x-1)+5}5+\frac{0,004}{50000(x-1,8)^2+1}$",truepoint(S),S);  

Dernière modification le Wed Sep 11 15:36:28 CEST 2013 par G.Marris       Valide XHTML