import graph;
picture pic;
real xsize=8cm, ysize=6cm;
size(pic,xsize,ysize,IgnoreAspect);
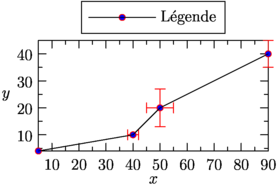
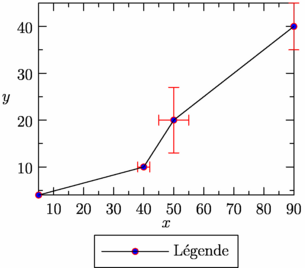
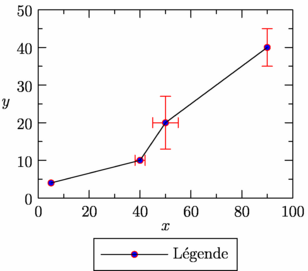
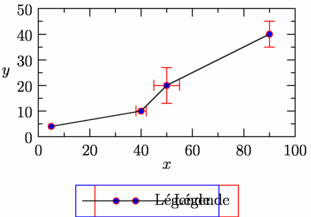
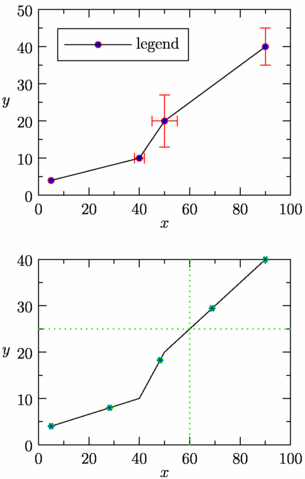
pair[] f={(5,4),(40,10),(50,20),(90,40)};
pair[] df={(0,0),(2,0),(5,7),(0,5)};
errorbars(pic,f,df,red);
draw(pic,graph(pic,f),"legend",
marker(scale(0.8mm)*unitcircle,red,FillDraw(blue),above=false));
scale(pic,true);
xaxis(pic,"$x$",BottomTop,LeftTicks);
yaxis(pic,"$y$",LeftRight,RightTicks);
legendmargin=5;
add(pic,legend(pic),point(pic,NW),20SE,UnFill);
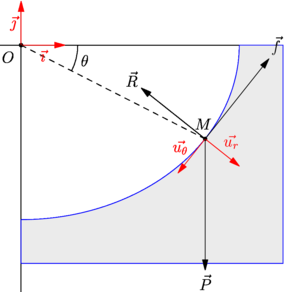
picture pic2;
size(pic2,xsize,ysize,IgnoreAspect);
frame mark;
filldraw(mark,scale(0.8mm)*polygon(6),green,green);
draw(mark,scale(0.8mm)*cross(6),blue);
draw(pic2,graph(pic2,f),marker(mark,markuniform(5)));
scale(pic2,true);
xaxis(pic2,"$x$",BottomTop,LeftTicks);
yaxis(pic2,"$y$",LeftRight,RightTicks);
xequals(pic2,60.0,green+Dotted);
yequals(pic2,25.0,green+Dotted);
add(pic.fit(),(0,0),N);
add(pic2.fit(),(0,-.5cm),S);