Liste des figures
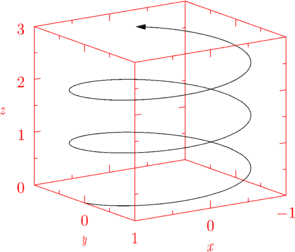
figure 0001
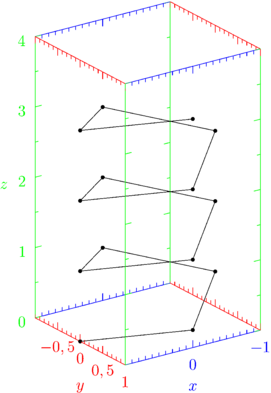
figure 0002
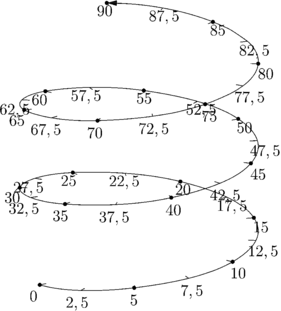
figure 0003
figure 0001
figure 0002
figure 0003

|
// Exemple de la galerie d'images officielle d'Asymptote // ... mais avec quelques commentaires supplémentaires. import graph3; size(7.5cm,0); size3(200,IgnoreAspect); currentprojection=orthographic(4,6,3); real x(real t) {return cos(2pi*t);} real y(real t) {return sin(2pi*t);} real z(real t) {return t;} path3 p=graph(x,y,z,0,2.7,operator ..); draw(p,Arrow3); /* void scale(picture pic=currentpicture, bool xautoscale=true, bool yautoscale=xautoscale, bool zautoscale=yautoscale); */ scale(true); xaxis3(XZ()*"$x$",Bounds,red,InTicks(Label,2,2)); yaxis3(YZ()*"$y$",Bounds,red,InTicks(beginlabel=false,Label,2,2)); zaxis3(XZ()*"$z$",Bounds,red,InTicks); |
|
|
// L'exemple précédent modifié. import graph3; size(7.5cm,0); size3(100,100,200,IgnoreAspect); currentprojection=orthographic(4,6,3); real x(real t) {return cos(2pi*t);} real y(real t) {return sin(2pi*t);} real z(real t) {return t;} path3 p=graph(x,y,z,0,3.25,n=13); draw(p); dot(p); scale(true); xaxis3("$x$",Bounds,blue,InTicks(Label)); yaxis3("$y$",Bounds,red,InTicks(beginlabel=false,Label)); zaxis3("$z$",Bounds,green,InTicks); |
|
|
// Exemple de la galerie d'images officielle d'Asymptote // ... mais avec quelques commentaires supplémentaires. import graph3; size(7.5cm,0); size3(200,IgnoreAspect); currentprojection=orthographic(4,6,3); real x(real t) {return cos(2pi*t);} real y(real t) {return sin(2pi*t);} real z(real t) {return t;} int nbrmorceaux=18, gradmax=nbrmorceaux*5, nbrgrad=nbrmorceaux*2; path3 p=graph(x,y,z,0,2.7,operator ..,n=nbrmorceaux); draw(p,Arrow3); dot(p); axis(p,InTicks(Label(align=-Z),nbrgrad), ticklocate(0,gradmax, new real(real v) { return v/gradmax*nbrmorceaux;}, new triple(real t) {return cross(dir(p,t),Z);})); |
Dernière modification le Tue Oct 22 19:00:43 CEST 2013 par G.Marris Valide XHTML